
KNPL Variance Project Documentation
Dashboard Overview
Steps to Access
- Open the application shortcut pinned to the Taskbar or on the Desktop.
- Login with your Username and Password. If you forget your password, contact the Admin.
- From the Main Menu, click on Dashboard to access the Variance Dashboard.
Standard Operating Procedure (SOP)
Purpose: To monitor input, output, and stock across all 12 tanks in real time.
Steps:
- Select From Date & Time and To Date & Time.
- Click Get Dashboard Data to refresh all sections.
- Review:
- Cumulative Tank Values – Input, Output, Stock with toggleable legends.
- Closing Stock by Level Transmitter – Graphical stock levels.
- Tank-wise Data – Inputs, outputs, opening & closing stock with transmitter value.
- Click Export to save results to Excel.
Expected Output: Consolidated tank variance view with graphical and tabular data.
The Variance Project Dashboard is designed to provide real-time insights into material movement, stock levels, and flow tracking across all 12 tanks situated in the New Solvent Yard, Old Solvent Yard, and Resin Yard. It consolidates data from flowmeters and level transmitters, processed through the SCADA system, and presents it in an interactive web-based interface.
The dashboard consists of the following major sections:
1. Date Range Selector
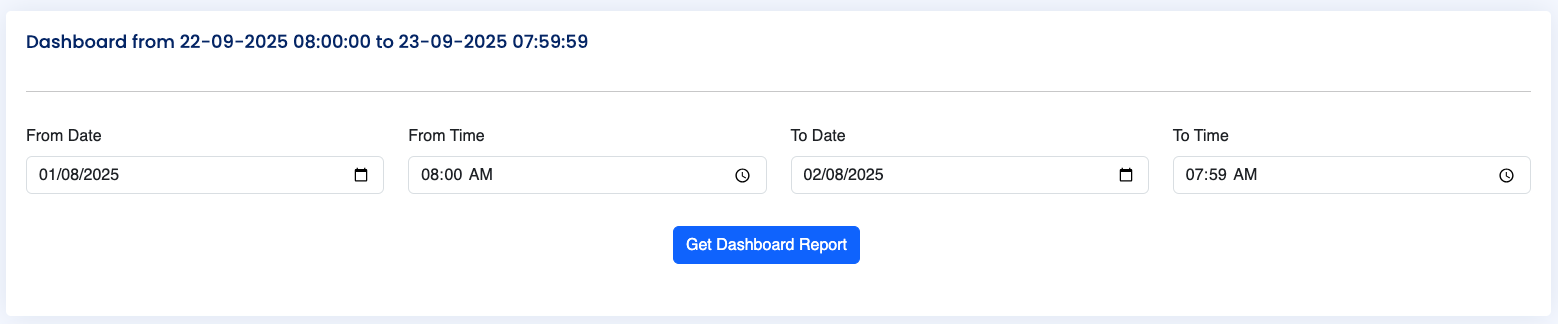
Figure: Date Range Selector
The Date Range Selector allows users to define the reporting period. Users can specify both From (Date & Time) and To (Date & Time) values. Default selected values on load of the page will be from yesterday 08:00:00 AM to today 07:59:59 AM. Once the range is selected, clicking “Get Dashboard Data” refreshes the dashboard to show all metrics for the chosen duration.
2. Cumulative Tank Values
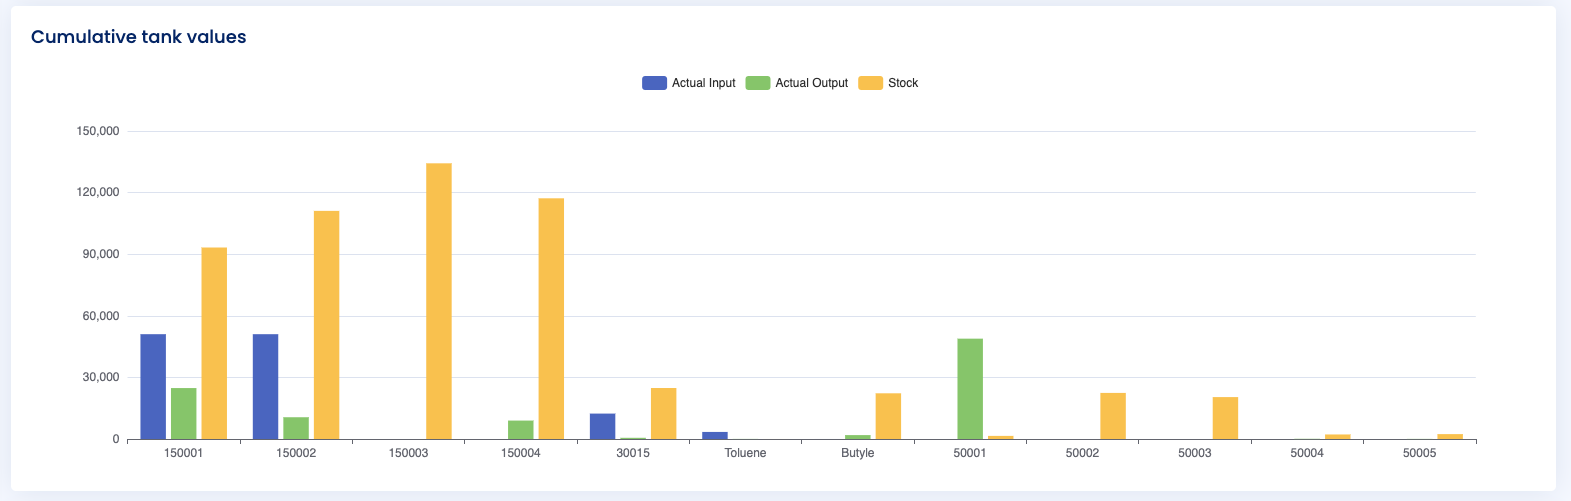
Figure: Cumulative Tank Values Graph
This section provides a graphical representation of actual input, actual output, and remaining stock for each tank, as of the selected To Date & Time. A legend is displayed above the chart, enabling users to toggle individual values on/off for focused analysis.
This visualization is particularly useful for identifying stock imbalances, input-output mismatches, and overall tank utilization trends.
3. Closing Stock (Level Transmitter Based)
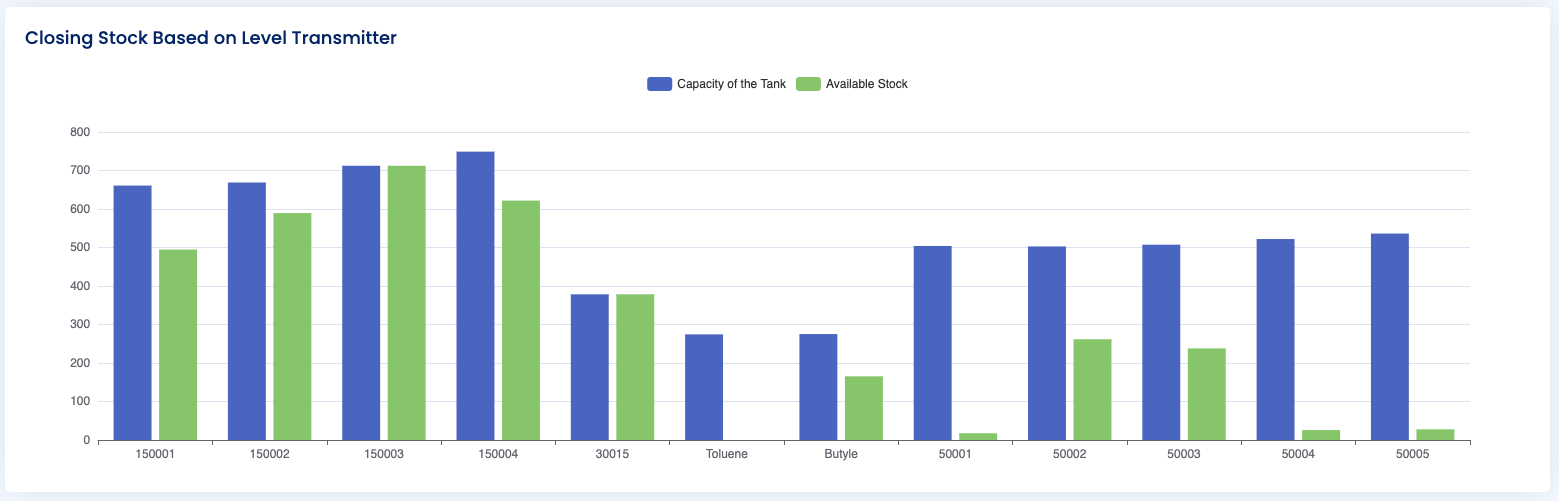
Figure: Closing Stock Based on Level Transmitter
This chart displays the available stock in each tank at the end of the selected period, as determined by the level transmitter. It compares the tank capacity versus the remaining stock value, offering a direct view of stock utilization efficiency.
4. Tank-Wise Detailed Values
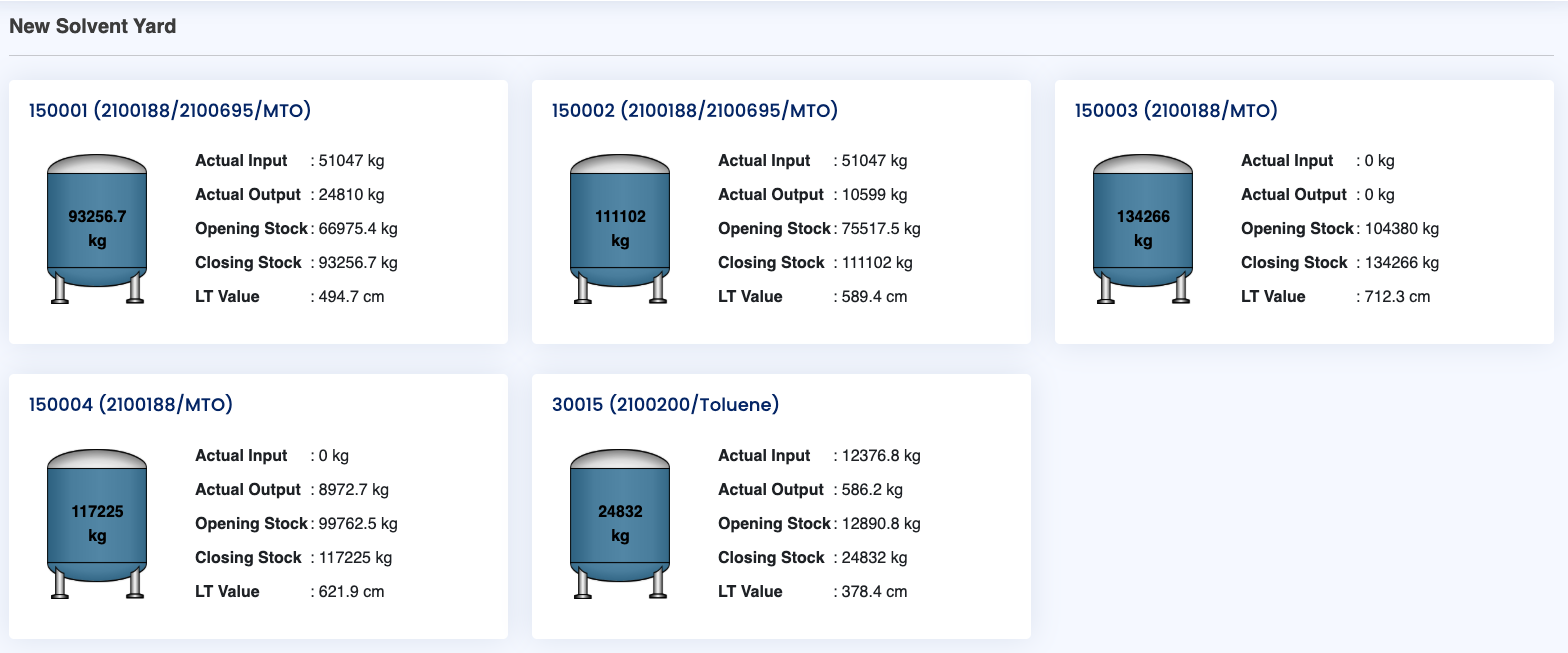
Figure: Tank-Wise Detailed Values
At the bottom of the dashboard, detailed tabular information for all 12 tanks is displayed, segregated by their yard location. Each tank entry contains:
- Remaining Stock (from level transmitter)
- Actual Input received during the period
- Actual Output dispatched during the period
- Opening Stock at the From Date & Time
- Closing Stock at the To Date & Time
- Level Transmitter Value (in cm)
This section acts as the most granular view, enabling operators to trace material flow, validate stock balances, and investigate anomalies at an individual tank level.