
KNPL Variance Project Documentation
Resin Yard Report
Steps to Access
- Login to the application using your Username and Password.
- From the Main Menu, navigate to Reports.
- Select Resin Yard Report to open the page.
Standard Operating Procedure (SOP)
- Select date range.
- Review stock movement across 5 tanks:
- Opening Stock (A)
- Inputs, Outputs (B)
- Closing Stock (C)
- Calculated Balance (D), Level Tx (E), Deviations
- Outputs → Mixer-Thinner, Pre-Mixer Slurry White, Pre-Mixer Slurry Colour
- Export report if required.
1. Date Selector
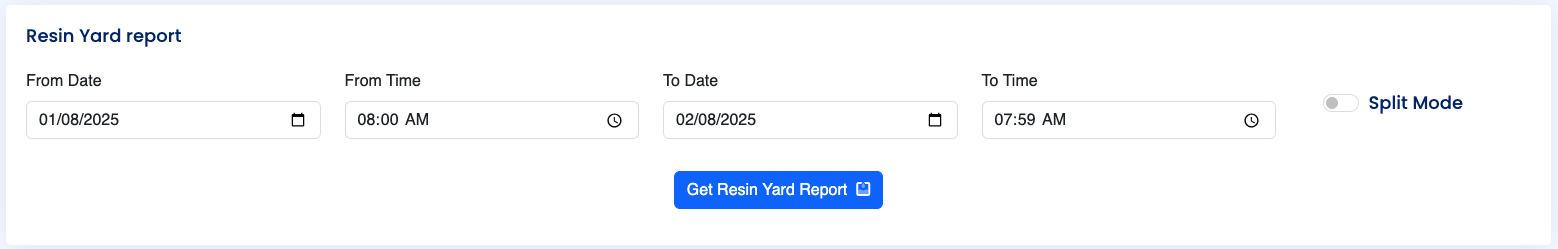
Figure: Date and Time Selection with Split Mode
The Date Selector in the Resin Yard Report functions the same way as in the Solvent Yard reports. By default, it loads data from yesterday 8:00 AM to today 7:59 AM. Split Mode can be enabled for day-wise breakdown within the selected range.
2. Report Details
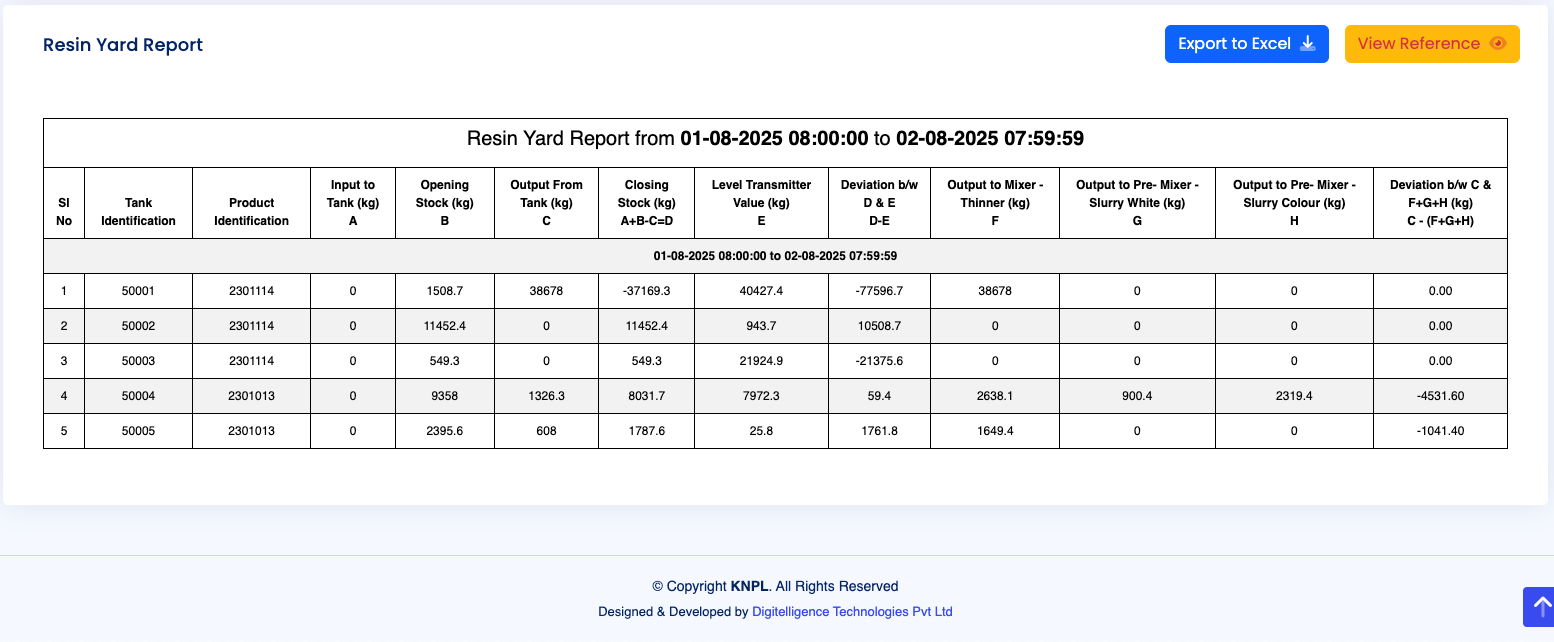
Figure: Tabular Report with Tank-wise Data
The Resin Yard consists of five tanks. Each report is generated for the selected date range, for example: “Resin Yard Report from 01-08-2025 08:00:00 to 02-08-2025 07:59:59”.
The tabular report contains the following fields:
- Sl No – Serial number of the record.
- Tank Identification – Unique tank ID.
- Product Identification – Material stored in the tank.
- Input to Tank (kg) – Measured inflow quantity.
- A: Opening Stock (kg) – Quantity at the beginning of the period.
- B: Output from Tank (kg) – Measured outflow quantity.
- C: Closing Stock (kg) – Quantity at the end of the period.
- D: Calculated Stock (A + Input – B) – Reconciliation of stock.
- E: Level Transmitter Value (kg) – Actual measured stock from LT.
- Deviation (D – E) – Difference between calculated and measured stock.
- F: Output to Mixer – Thinner (kg) – Downstream output.
- G: Output to Pre-Mixer – Slurry White (kg) – Downstream output.
- H: Output to Pre-Mixer – Slurry Colour (kg) – Downstream output.
- Deviation (C – (F+G+H)) – Reconciliation between closing stock and distributed outputs.
This structure ensures that every tank’s opening stock, inputs, outputs, and closing balances can be reconciled both mathematically and against the level transmitter readings. Any deviations are clearly highlighted for variance analysis.
As with other yard reports, results can be exported to Excel using the Export to Excel button.
3. Process Schematic and Reference
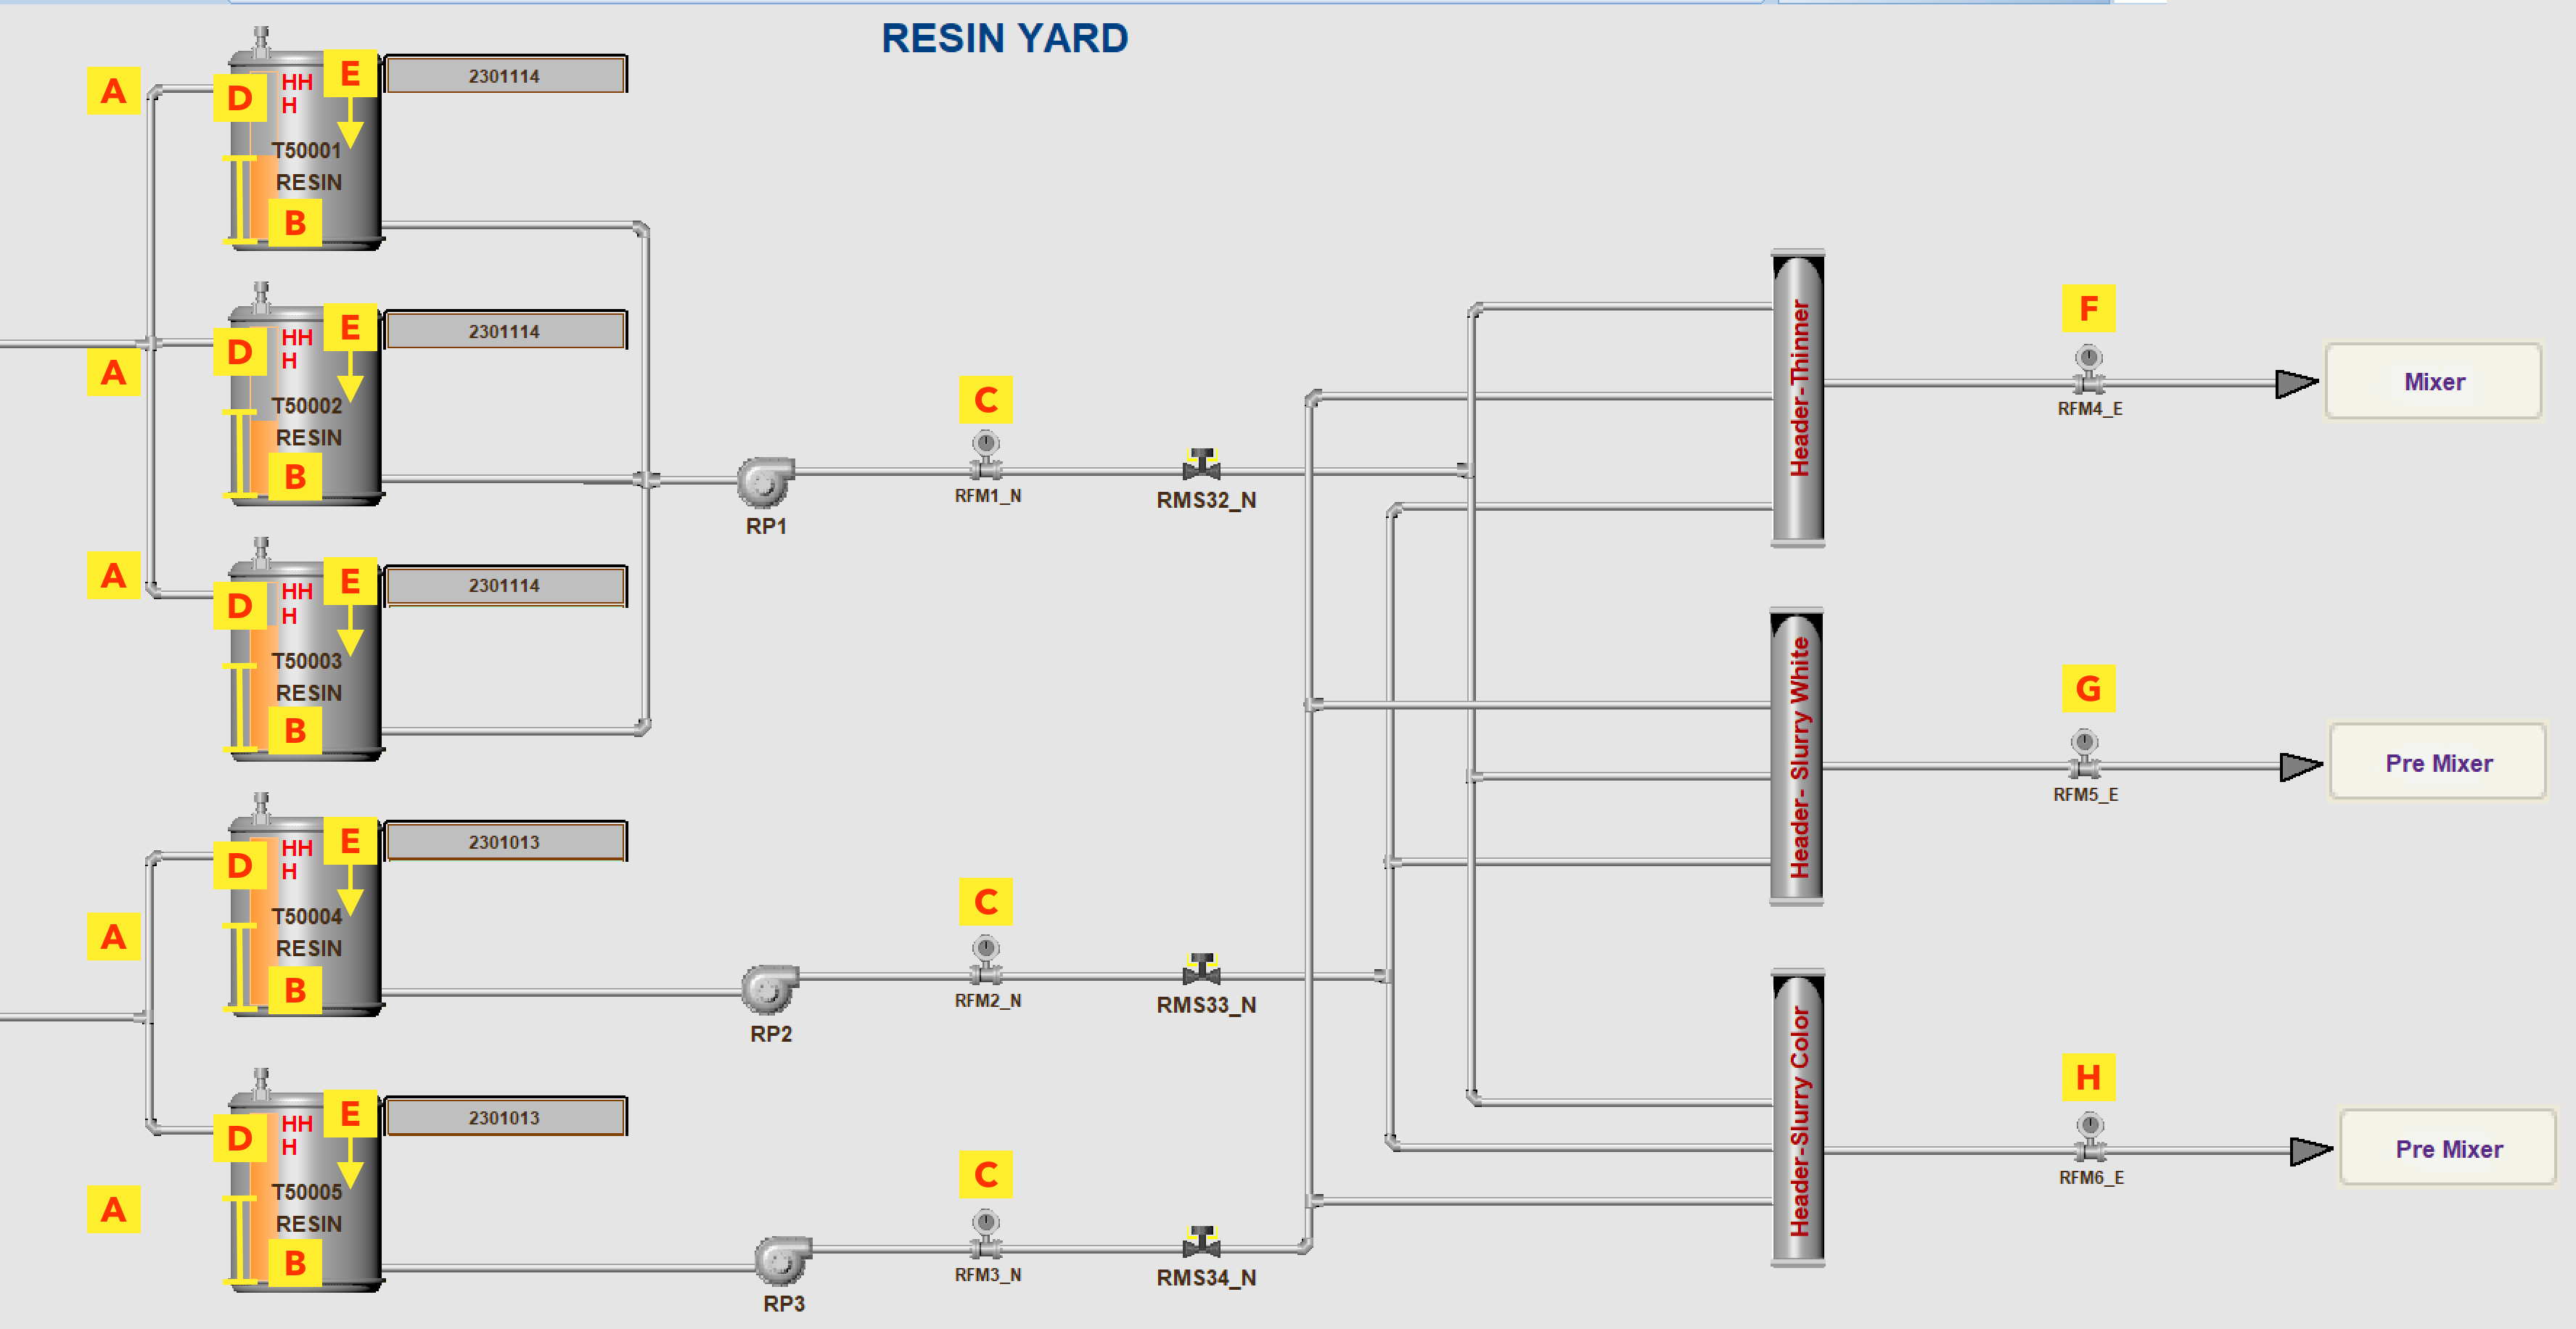
Figure: Resin Yard Flow Diagram with Alphabetic Reference
The schematic shows the flow of resin across all five tanks, with reference points (A–H) marked in yellow. These correspond to inputs, outputs, opening and closing stocks, level transmitter readings, and distributions to downstream processes.
The “View Reference” button within the report provides a quick mapping guide to these references in the context of the tabular data.