
KNPL Variance Project Documentation
SCADA – General Operations
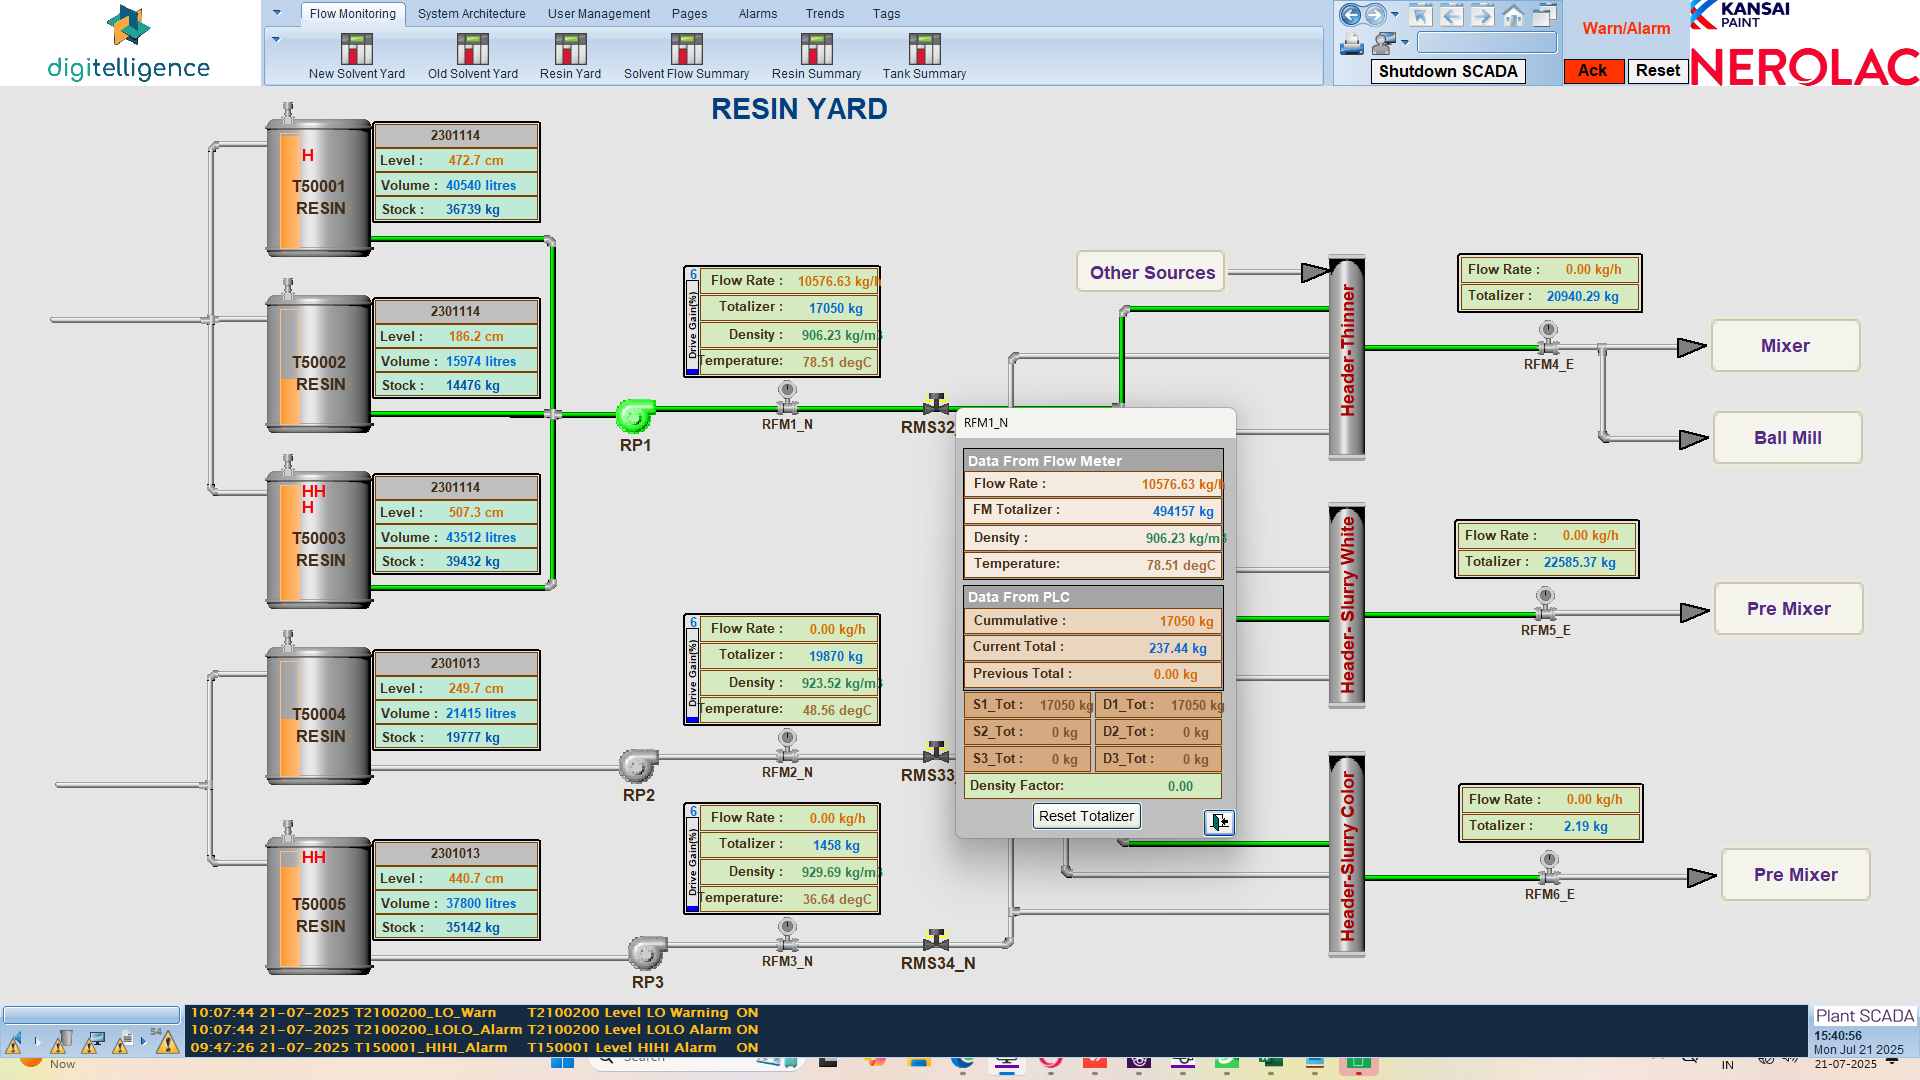
The SCADA General Operations guide provides an overview of how to interact with different SCADA screens for tanks and flow meters. It explains how to drill down into specific readings, visualize historical data, and monitor process trends.
Steps to Access and Operate
- Log into the Plant SCADA system.
- Select the desired yard or tank screen (e.g., Resin Yard, Solvent Yard).
- Click on any flow meter to view its detailed real-time values (flow rate, density, temperature, etc.).
- Click on the Totalizer of a flow meter to access its historical trend graph.
- Select the date range for which you want to visualize the totalizer trend.
- Analyze historical flow/consumption patterns and compare them with current readings.
- Monitor warnings and alarms, which appear at the bottom of the SCADA screen.
- To acknowledge an alarm, click the Acknowledgement button located at the top right corner of the SCADA window.
Trend Checking
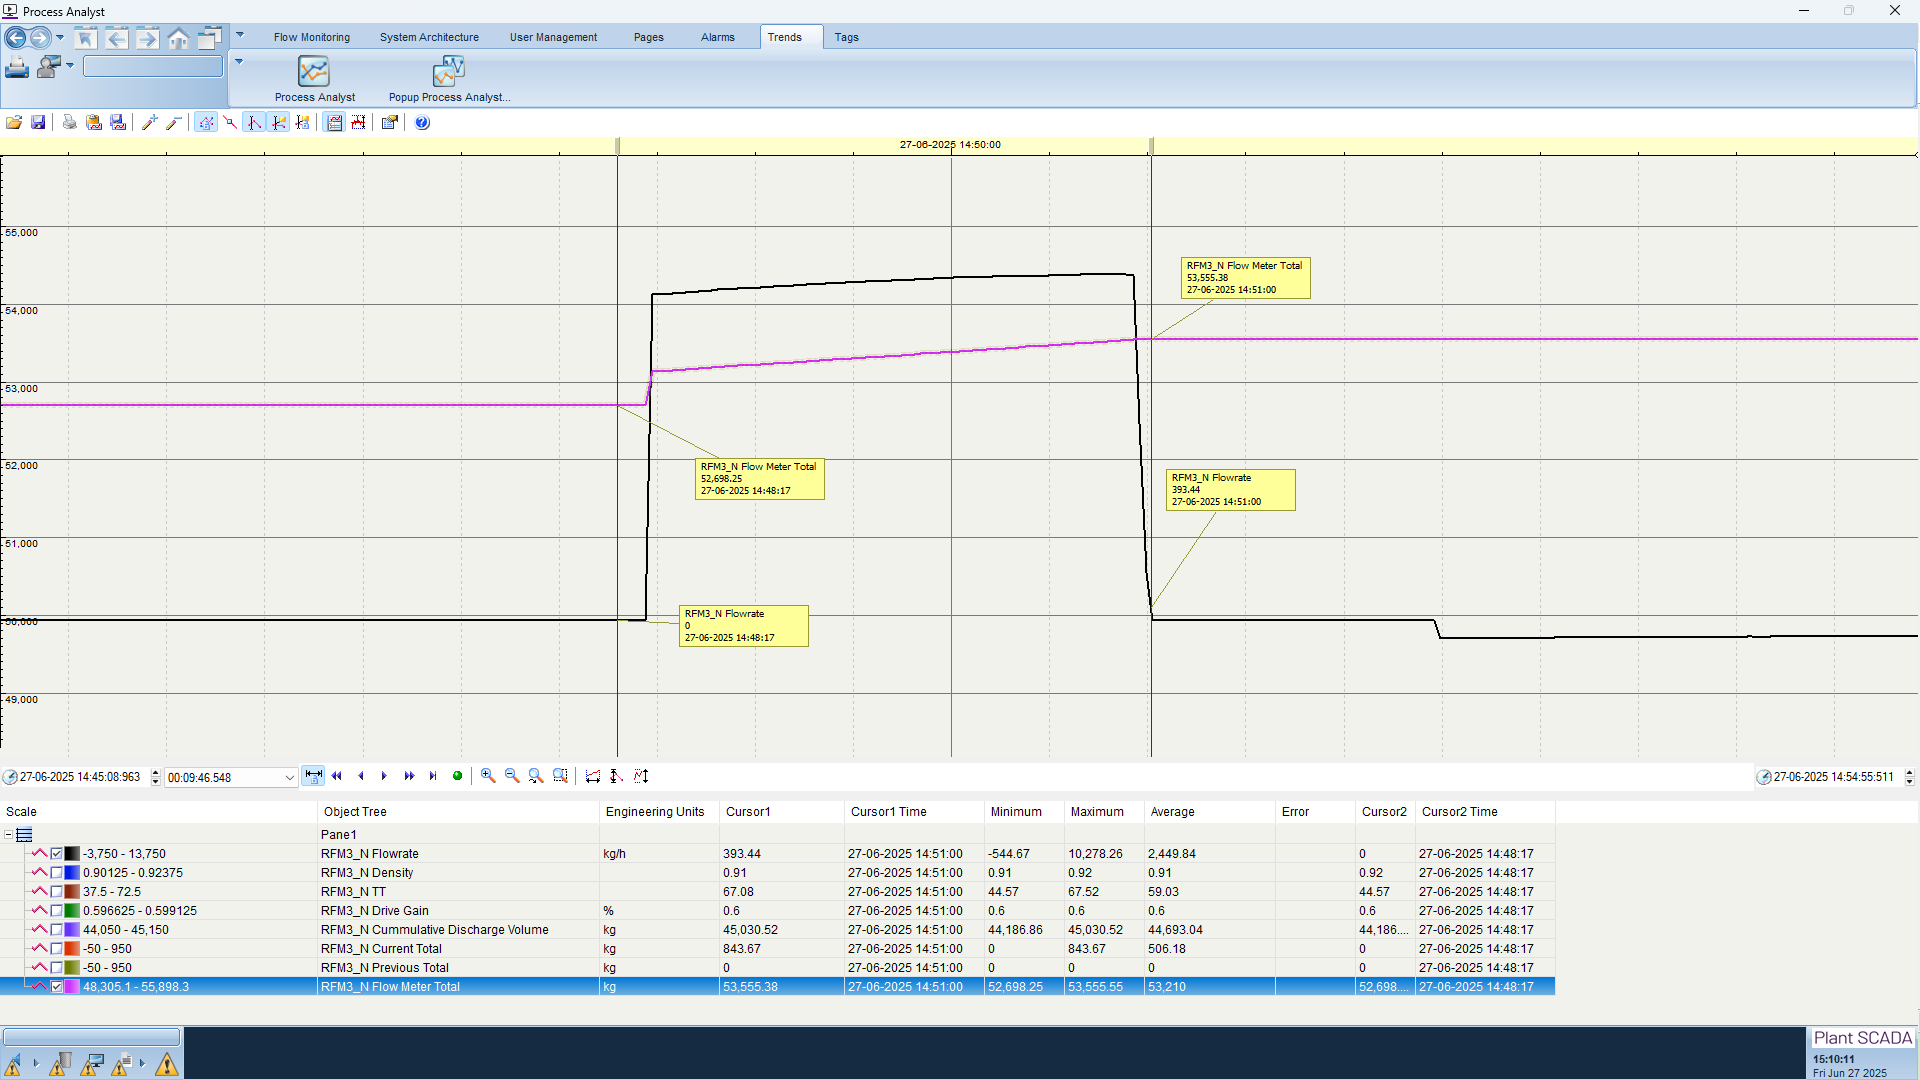
The Trend Checking feature allows operators to visualize the historical performance of each flow meter. By clicking on the Totalizer, a graph opens showing the recorded flow values over time. Operators can select a custom date range to analyze specific intervals and assess variations in consumption or flow. This helps in detecting abnormal usage patterns, validating sensor accuracy, and ensuring smooth plant operations.
Standard Operating Procedure (SOP)
- Always start from the SCADA overview screen of the respective yard.
- Click individual flow meters to verify live readings.
- Use the trend feature to monitor performance of flow meters over time.
- Ensure correct date range is selected while analyzing totalizer trends.
- Keep an eye on the Warnings and Alarms section at the bottom of the screen.
- When an alarm is raised, acknowledge it using the Acknowledgement button on the top right corner.
- Document any anomalies and escalate to the control room supervisor if required.