
KNPL Variance Project Documentation
Old Solvent Yard Report
Steps to Access
- Login to the application using your Username and Password.
- From the Main Menu, navigate to Reports.
- Select Old Solvent Yard Report to open the page.
Standard Operating Procedure (SOP)
- Choose date & time range.
- Review data for 2 tanks:
- Input, Output, Stock values
- Deviation with Level Transmitter
- Click Export to save as Excel.
1. Date Selector
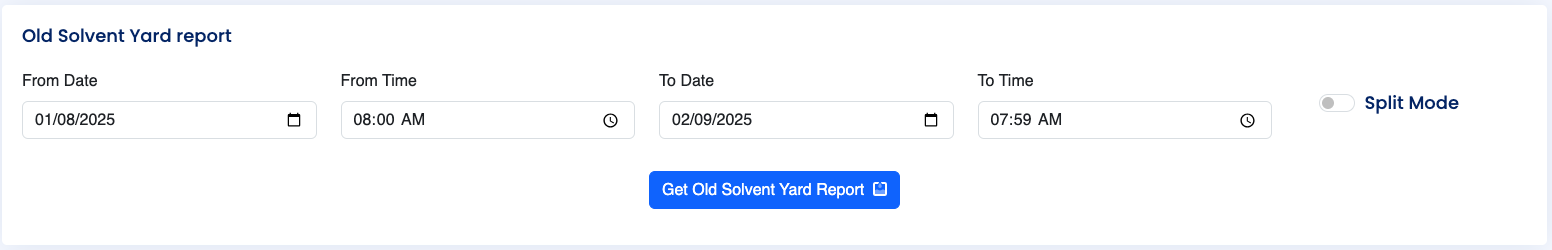
Figure: Date and Time Selection with Split Mode
The Date Selector works exactly as in the New Solvent Yard report. By default, it loads data from yesterday 8:00 AM to today 7:59 AM. You can also enable Split Mode to break the report into day-wise intervals between the selected From and To dates.
2. Report Details
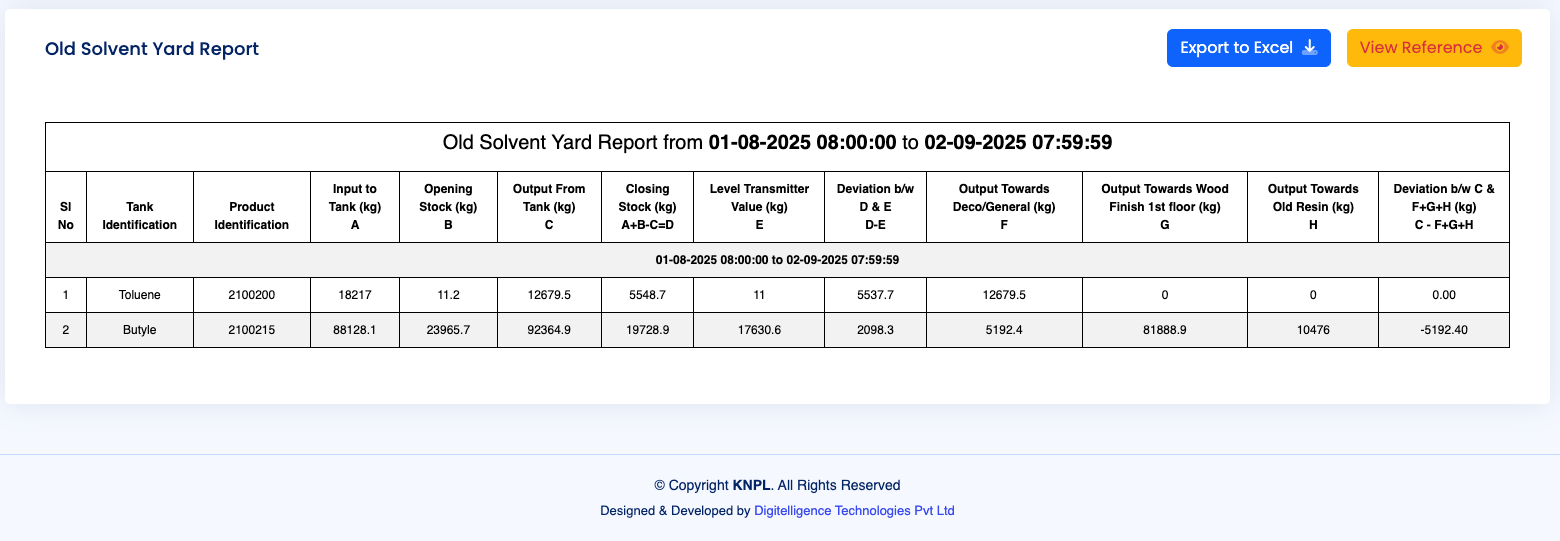
Figure: Tabular Report with Tank-wise Data
The Old Solvent Yard has two tanks (Toluene and Butyle). The report allows you to track:
- Closing Stock vs. Level Transmitter Values to identify any variance.
- Input, Output, and Opening Stock calculations for reconciliation.
- Distribution of Output across multiple destinations like Deco/General, Wood Finish 1st Floor, and Old Resin.
- Reports can be exported to Excel at any time using the Export to Excel button provided on the top right of the report section.
3. Process Schematic and Reference
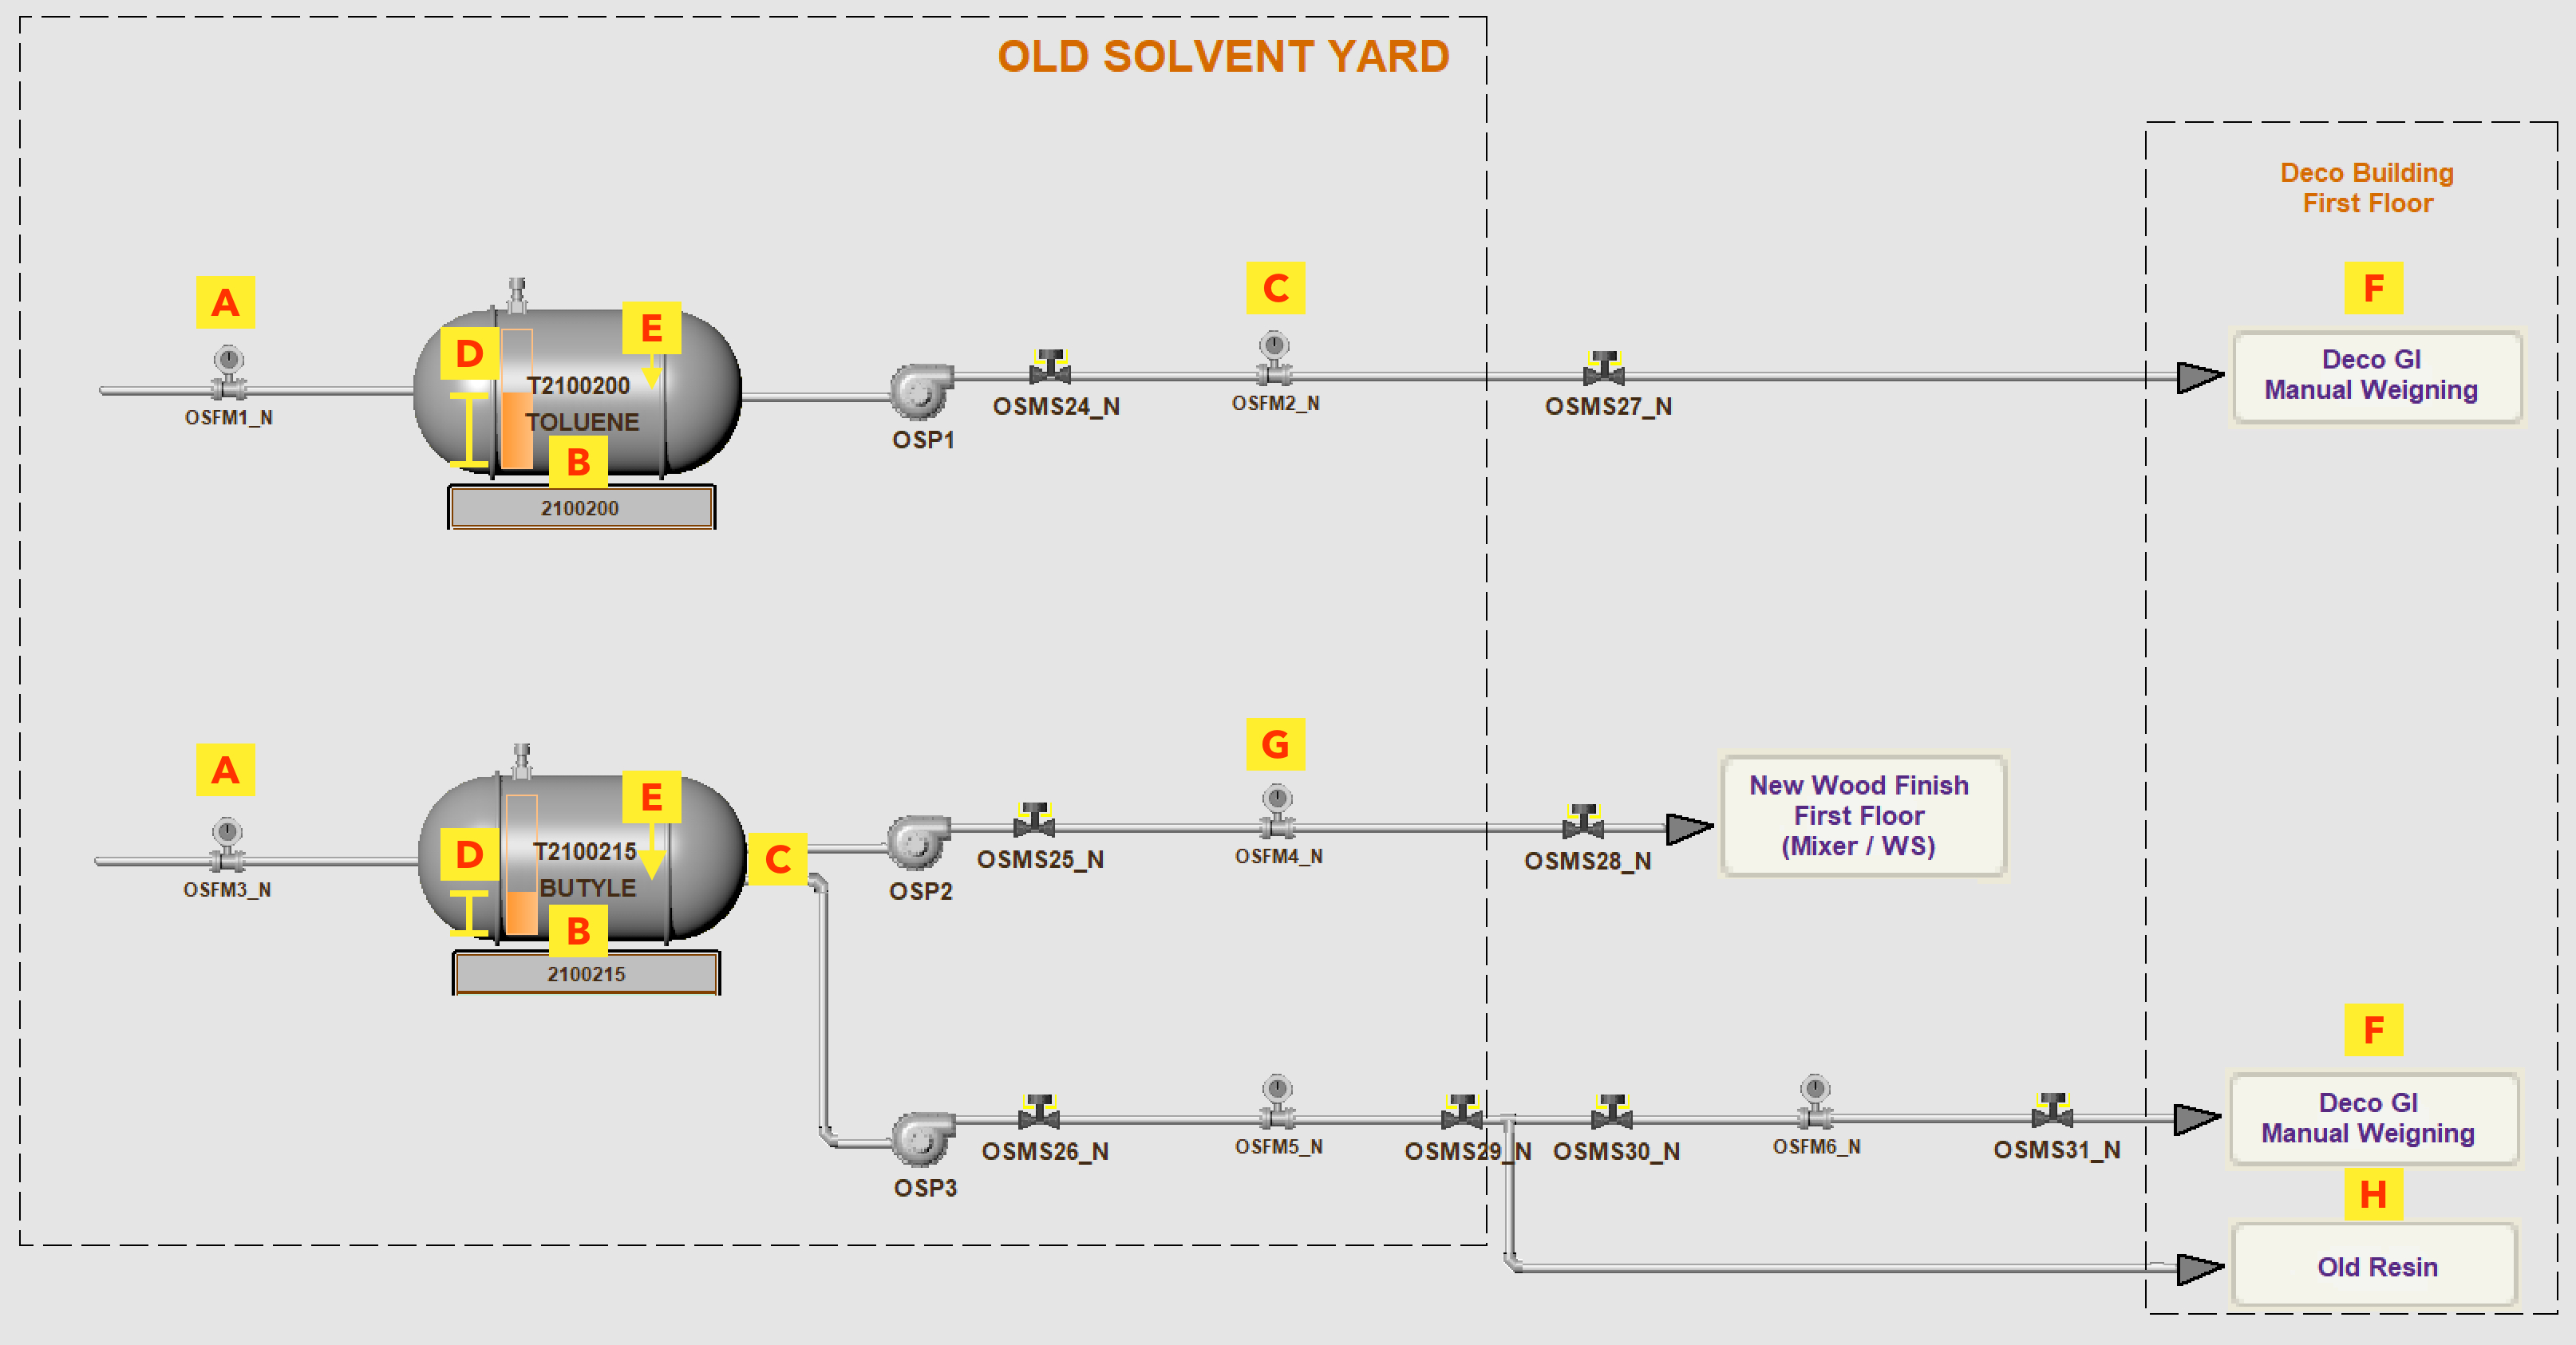
Figure: Old Solvent Yard Flow Diagram with Alphabetic Reference
Just like in the New Solvent Yard, this schematic diagram shows the solvent flow for the two tanks, with reference points (A–H) marked in yellow. These references are consistent across all yard reports for easier comparison.
The reference mapping is as follows:
- A – Input Flow Meter (Solvent Inlet)
- B – Tank Opening Stock
- C – Output Flow Meter (Tank Outlet)
- D – Level Transmitter
- E – Closing Stock (calculated)
- F – Output Towards Deco / General
- G – Output Towards Wood Finish 1st Floor
- H – Output Towards Old Resin
You can also click on the “View Reference” button in the report to visualize the same mapping directly on the table.